


LINK:http://www.mediafire.com/file/v2kprfryq97440d/LOW_POWER_TRANSFORMER.pdf/file
domingo, 19 de abril de 2020
Оптимальное проектирование силовых высокочастотных ферромагнитных устройств-Optimal design of power high-frequency ferromagnetic devices

Оптимальное проектирование силовых высокочастотных ферромагнитных устройств
Авторы: Р.X. Бальян, В.П. Обрусник.
Optimal design of power high-frequency ferromagnetic devices.
Authors: R.X. Balian, V.P. Litterberry
Abstract: The book summarizes the modern achievements of science and practice in designing high-frequency ferromagnetic devices (microwave FMU), which include transformers, saturation chokes, phase multipliers, etc. A complete scheme of the engineering design of the microwave FMU is given, based on a small number of simple expressions proposed and proved in the book. Examples of the optimal calculation of high-frequency transformers and inductors up to 200 kVA per phase are given. High accuracy of the final results of designing a microwave FMU for a frequency range of 0.4-100 kHz is guaranteed. For specialists involved in the design of electronic and conversion systems, as well as for university students of electrical and radio engineering profiles.
Аннотация издательства: В книге обобщены современные достижения науки и практики по проектированию высокочастотных ферромагнитных устройств (СВЧ ФМУ), к которым относятся трансформаторы, дроссели насыщения, умножители числа фаз и т.д. Дается полная схема инженерного проектирования СВЧ ФМУ, базирующаяся на небольшом количестве простых выражений, предложенных и доказанных в книге. Приведены примеры оптимального расчета высокочастотных трансформаторов и дросселей до 200 кВА на фазу. Гарантируется высокая точность конечных результатов проектирования СВЧ ФМУ для диапазона частот 0,4-100 кГц. Для специалистов, занимающихся вопросами проектирования электронных и преобразовательных систем, а также для студентов вузов электротехнического и радиотехнического профилей.
LINK: http://www.mediafire.com/file/go1qc40yohomjyu/design_of_power_high-frequency_ferromagnetic_devices.pdf/file
sexta-feira, 17 de abril de 2020
Master Degree Thesis Data Analysis and Modeling for Fault Detection in Solar Photovoltaic (PV) System- Mokpo National University Department of Electronics Engineering-Author Prasis - 광전지(PV) 시스템의 고장 탐지를 위한 테이터 분석 및 모델링South Korea


Prasis Poudel A thesis Submitted for Partial Fulfilment of the Requirements for the Degree of Master of Engineering Department of Electronics Engineering
Graduate School Mokpo National University August, 2017
광전지(PV) 시스템의 고장 탐지를 위한 데이터
분석 및 모델링
ABSTRACT
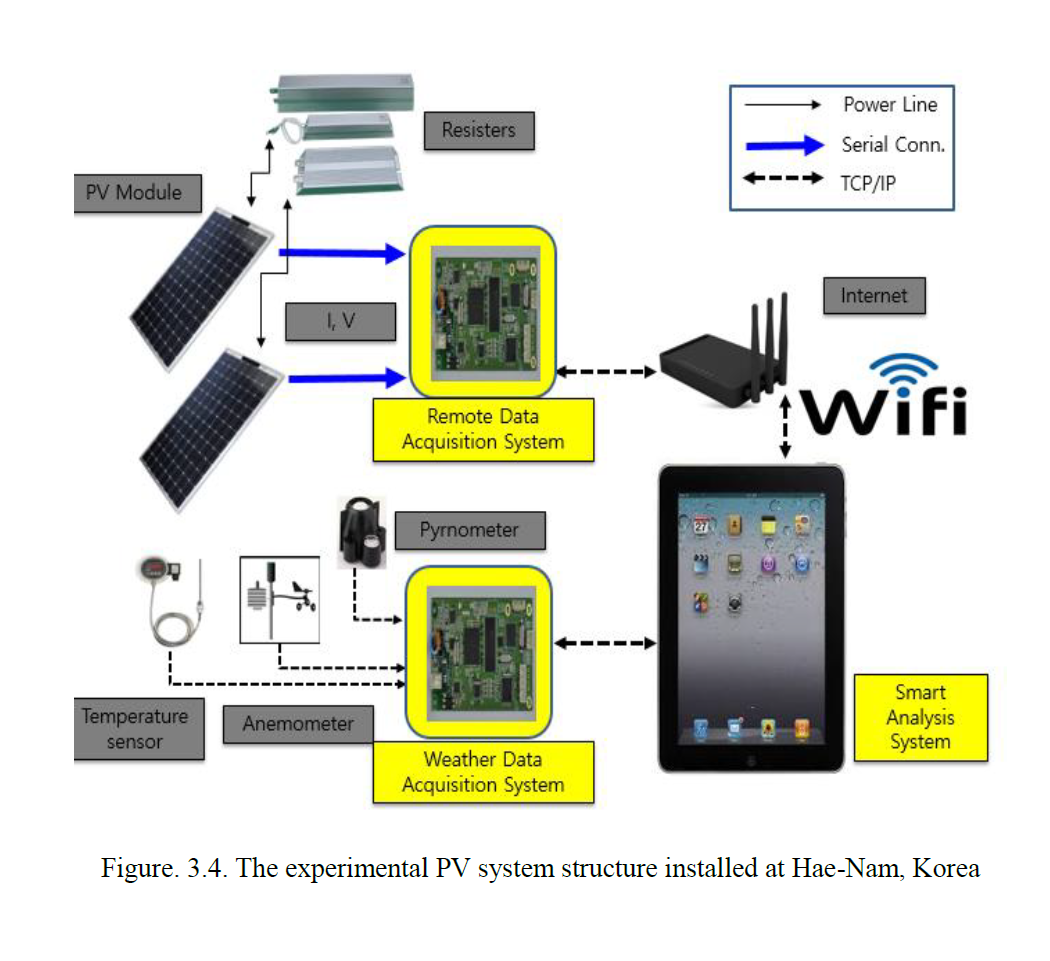
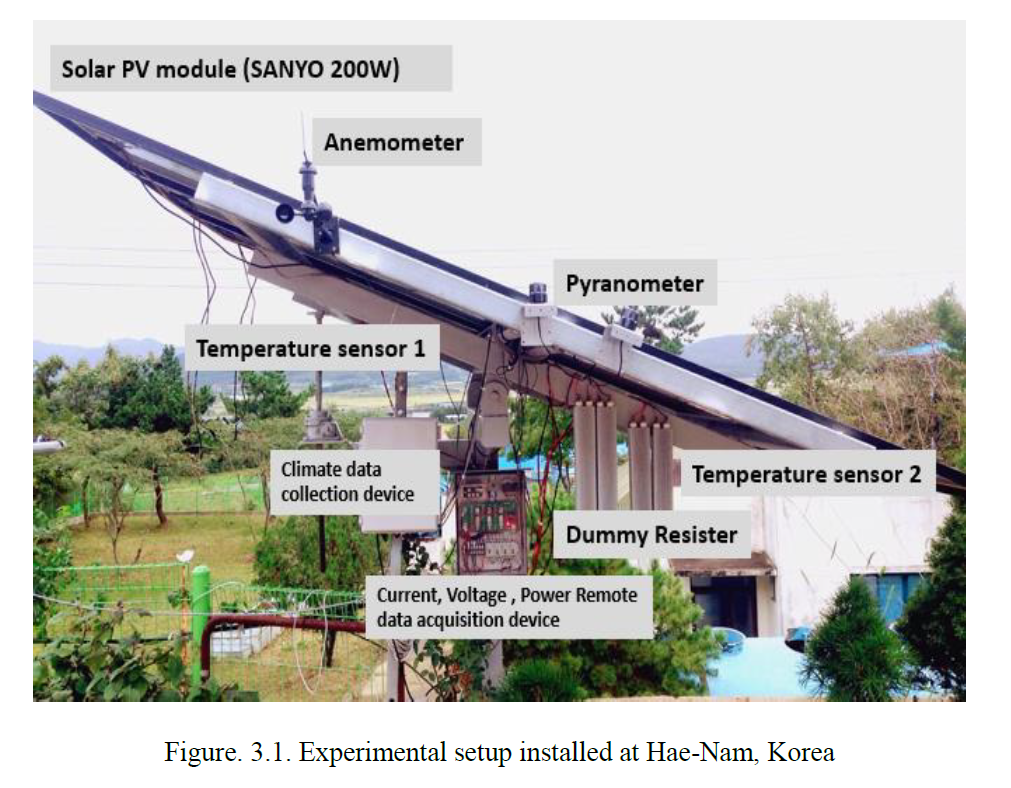
This thesis presents the solar (PV) Power output data analysis and modelling using least mean square (LMS), linear regression and multiple linear regression algorithms and comparison between them to find the best model for applying in the PV system Fault detection. This method has been developed and validated using climatic and electrical output obtained from a SANYO 200 Wp photovoltaic modules installed at the Hae-Nam, Korea. This modelling includes the correlation of solar PV power output and solar irradiation. In modelling algorithms, PV power is modelled adaptively as a function of solar irradiation and each model is compared in terms of estimated error performance based on statistical and graphical methods. From the result, it was found that the multiple linear regression modelling is the best for solar PV modelling with MSE 0.00818 with modelling error 1.58% which is less than that compared to the model using the least Mean square (LMS) having 1.97% and linear regression 5.98%. ii | P a g e After successfully modelled, the solar Photovoltaic (PV) power output as a function of solar irradiance, resulting best model is used for the development of practical fault detection. Our modelling results had fairly low complexity with high fault detection rates. The fault detection is based on the analysis of the power losses using the linear regression modelling. The model estimated by stepwise linearity of the PV power output as a function of irradiance. The results obtained from this modelling indicate that the under normal condition the solar radiation and PV power output have a very strong positive correlation and very useful for solar PV data prediction. In addition, the observations below the proposed linear functions are considered as the faulty PV data. From Overall results, we can conclude that this PV system data modelling and fault detection approach is reasonable for PV power estimation and faulty data analysis.
LINK
http://www.riss.kr/search/detail/DetailView.do?p_mat_type=be54d9b8bc7cdb09&control_no=6310cda13afffe46ffe0bdc3ef48d419
domingo, 12 de abril de 2020
Deep Learning for Medical Imaging: COVID-19 Detection-MATLAB-MATHWORKS- Dr. Barath Narayanan


Barath Narayanan
Posted by Johanna Pingel, March 18, 2020
I'm pleased to publish another post from Barath Narayanan, University of Dayton Research Institute (UDRI), LinkedIn Profile. Co-author: Dr. Russell C. Hardie, University of Dayton (UD) Dr. Barath Narayanan graduated with MS and Ph.D. degree in Electrical Engineering from the University of Dayton (UD) in 2013 and 2017 respectively. He currently holds a joint appointment as a Research Scientist at UDRI's Software Systems Group and as an Adjunct Faculty for the ECE department at UD. His research interests include deep learning, machine learning, computer vision, and pattern recognition. In this blog, we are applying a Deep Learning (DL) based technique for detecting COVID-19 on Chest Radiographs using MATLAB.
Background
Coronavirus disease (COVID-19) is a new strain of disease in humans discovered in 2019 that has never been identified in the past. Coronavirus is a large family of viruses that causes illness in patients ranging from common cold to advanced respiratory syndromes such as Middle East Respiratory Syndrome (MERS-COV) and Severe Acute Respiratory Syndrome (SARS-COV). Many people are currently affected and are being treated across the world causing a global pandemic. In the United States alone, 160 million to 214 million people could be infected over the course of the COVID-19 epidemic (https://www.nytimes.com/2020/03/13/us/coronavirus-deaths-estimate.html). Several countries have declared a national emergency and have quarantined millions of people. Here is a detailed article on how coronavirus affects people: https://www.nytimes.com/article/coronavirus-body-symptoms.html
Detection and diagnosis tools offer a valuable second opinion to the doctors and assist them in the screening process. This type of mechanism would also assist in providing results to the doctors quickly. In this blog, we are applying a Deep Learning (DL) based technique for detecting COVID-19 on Chest Radiographs using MATLAB.
The COVID-19 dataset utilized in this blog was curated by Dr. Joseph Cohen, a postdoctoral fellow at the University of Montreal. Thanks to the article by Dr. Adrian Rosebrock for making this chest radiograph dataset reachable to researchers across the globe and for presenting the initial work using DL. Note that we solely utilize the x-ray images. You should be able to download the images from the article directly. After downloading the ZIP files from the website and extracting them to a folder called "Covid 19", we have one sub-folder per class in "dataset". Label "Covid" indicates the presence of COVID-19 in the patient and "normal" otherwise. Since, we have equal distribution (25 images) of both classes, there is no class imbalance issue here.
K-fold Validation
As you already know that there is a limited set of images available in this dataset, we split the dataset into 10-folds for analysis i.e. 10 different algorithms would be trained using different set of images from the dataset. This type of validation study would provide us a better estimate of our performance in comparison to typical hold-out validation method.
We adopt ResNet-50 architecture in this blog as it has proven to be highly effective for various medical imaging applications [1,2].


LINK
https://blogs.mathworks.com/deep-learning/2020/03/18/deep-learning-for-medical-imaging-covid-19-detection/
sábado, 11 de abril de 2020


Assinar:
Postagens (Atom)


 JOSIL ARTISTA PLASTICO FORTALEZA CEARA BRASIL AV.HERACLITO GRAÇA 41 TEL(85)32542378